Example
To illustrate the use of these tools in practice, we employ the simple model of the U.S. ex-post real interest rate from Garcia and Perron (1996) that is used as an example by Bai and Perron (2003a). The data, which consist of observations for the three-month treasury rate deflated by the CPI for the period 1961q1–1983q3, are provided in the series RATES in the workfile “realrate.WF1”.
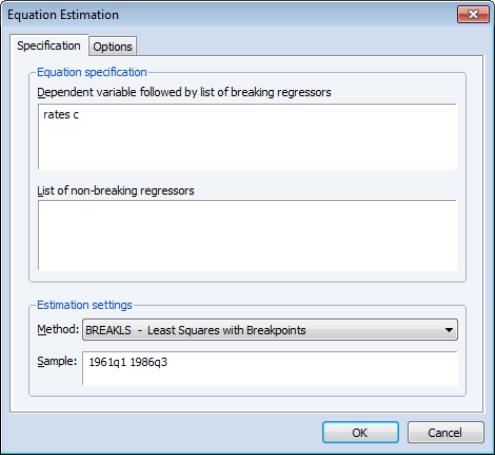
Select or from the main menu or enter the command in the command line and hit Enter.
The regression model consists of a regime-specific constant regressor so we enter the dependent variable RATES and C in the topmost edit field. The sample is set to the full workfile range.
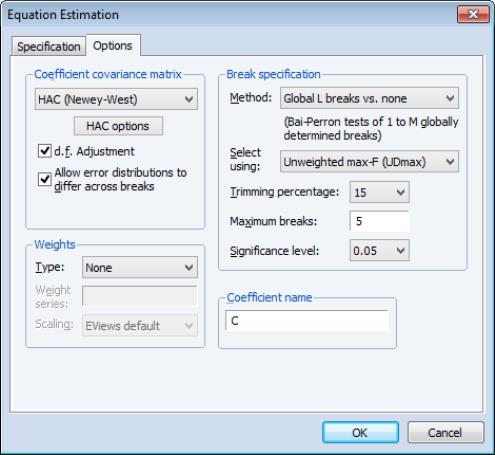
Next, click on the tab and specify standard errors, check , choose the method using the test to determine the number of breaks,and set a of 15, and a of 0.05.
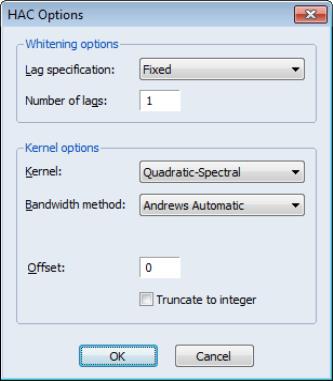
Lastly, to match the test example in Bai and Perron (2003a), we click on the button and set the options to use a kernel with bandwidth and single pre-whitening lag:
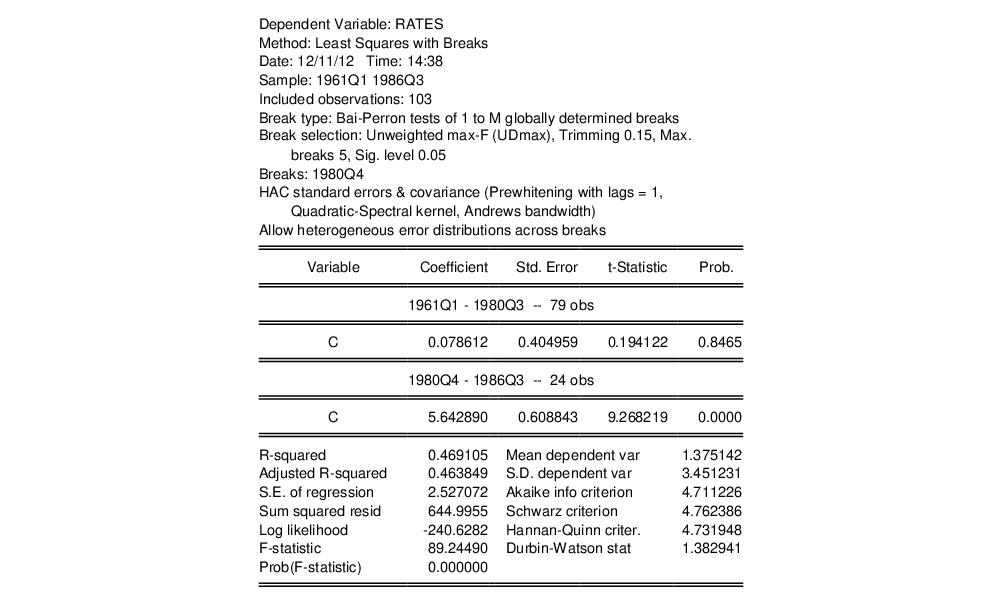
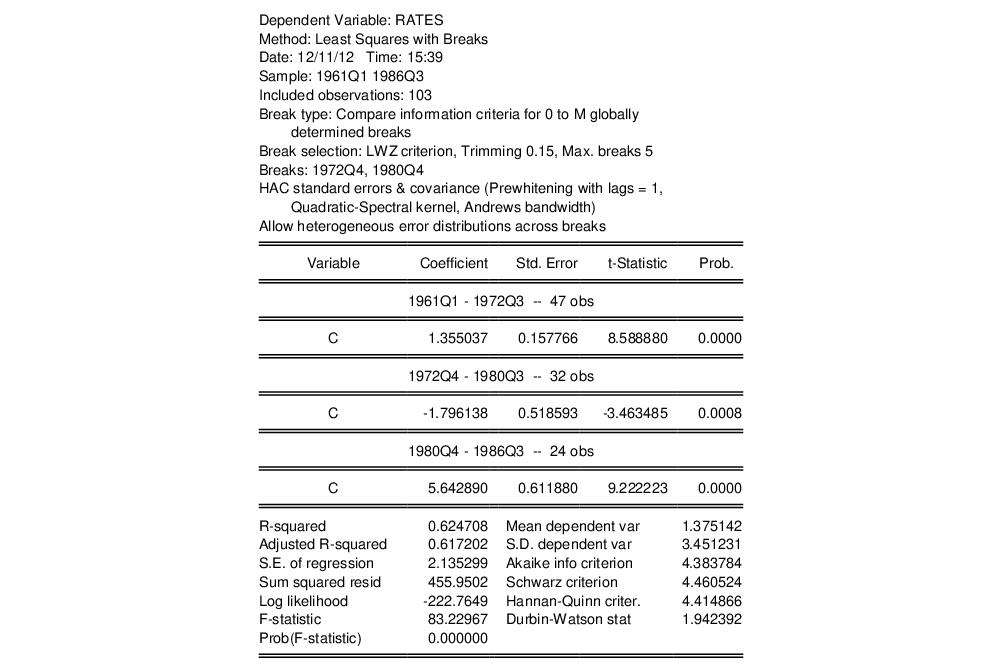
Click on to accept the settings and estimate the model. EViews displays the results of the breakpoint selection and coefficient estimation:
The

methodology selects a single statistically significant break at 1980Q4. The results clearly show a significant difference in the mean RATES prior to and after 1980Q4.
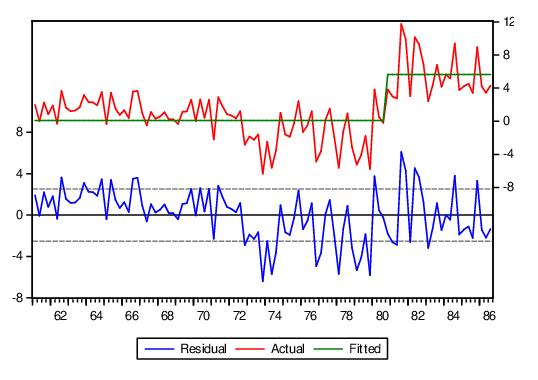
Click on , to see in-sample fitted data alongside the original series and the residuals:
Casual inspection of the residuals suggests that the model might be improved with the addition of another breakpoint in the early 1970s. Click on the button, select the tab, and modify the to use the with . Click on to re-estimate the equation using the new method.
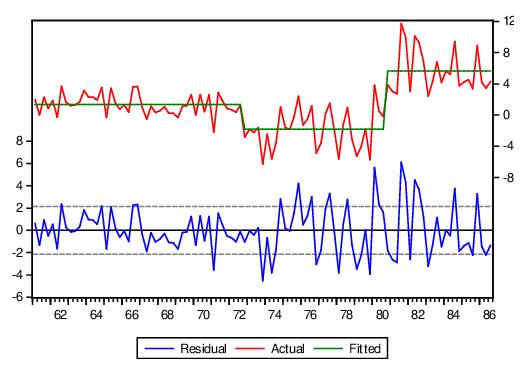
EViews reports new estimates featuring two breaks(1972Q4, 1980Q4) defining a medium, low, and a high rate regime, respectively:
The corresponding actual, fitted, residual plot is given by