N-Way Tabulation
This view classifies the observations in the current sample into cells defined by the series in the group. You can display the cell counts in various forms and examine statistics for independence among the series in the group. which opens the tabulation dialog.
Many of the settings will be familiar from our discussion of one-way tabulation in
“One-Way Tabulation”.
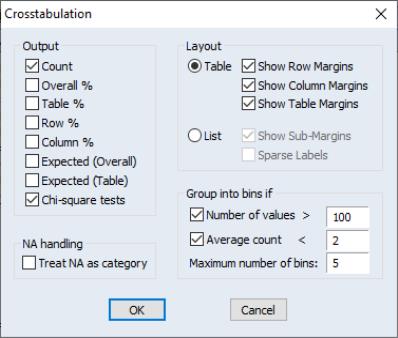
Group into Bins If
If one or more of the series in the group is continuous and takes many distinct values, the number of cells becomes excessively large. This option provides you two ways to automatically bin the values of the series into subgroups.
• Number of values option bins the series if the series takes more than the specified number of distinct values.
• Average count option bins the series if the average count for each distinct value of the series is less than the specified number.
• Maximum number of bins specifies the approximate maximum number of subgroups to bin the series. The number of bins may be chosen to be smaller than this number in order to make the bins approximately the same size.
The default setting is to bin a series into approximately 5 subgroups if the series takes more than 100 distinct values or if the average count is less than 2. If you do not want to bin the series, unmark both options.
NA Handling
By default, EViews drops observations from the contingency table where any of the series in the group has a missing value. Treat NA as category option includes all observations and counts NAs in the contingency table as an explicit category.
Layout
This option controls the display style of the tabulation. The
Table mode displays the categories of the first two series in

tables for each category of the remaining series in the group.
The
List mode displays the table in a more compact, hierarchical form. The
Sparse Labels option omits repeated category labels to make the list less cluttered. Note that some of the conditional

statistics are not displayed in list mode.
Output
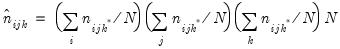
To understand the options for output, consider a group with three series. Let (
i,
j,
k) index the bin of the first, second, and third series, respectively. The number of observations in the (
i,
j,
k)-th cell is denoted as

with a total of
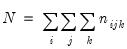
observations.
• Overall% is the percentage of the total number of observations accounted for by the cell count.
• Table% is the percentage of the total number of observations in the conditional table accounted for by the cell count.
• Row% is the percentage of the number of observations in the row accounted for by the cell count.
• Column% is the percentage of the number of observations in the column accounted for by the cell count.
The overall expected count in the (i, j, k)-th cell is the number expected if all series in the group were independent of each other. This expectation is estimated by:
 | (12.21) |
The
table expected count

is estimated by computing the expected count for the conditional table. For a given table, this expected value is estimated by:
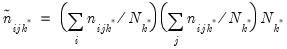 | (12.22) |
where

is the total number of observations in the

table.
Chi-square Tests
If you select the
Chi-square tests option, EViews reports

statistics for testing the independence of the series in the group. The test statistics are based on the distance between the actual cell count and the count expected under independence.
• . EViews reports the following two test statistics for overall independence among all series in the group:
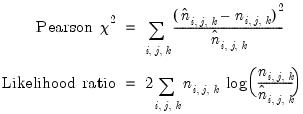 | (12.23) |
where

and

are the actual and overall expected count in each cell. Under the null hypothesis of independence, the two statistics are asymptotically distributed

with

degrees of freedom where

are the number of categories for each series.
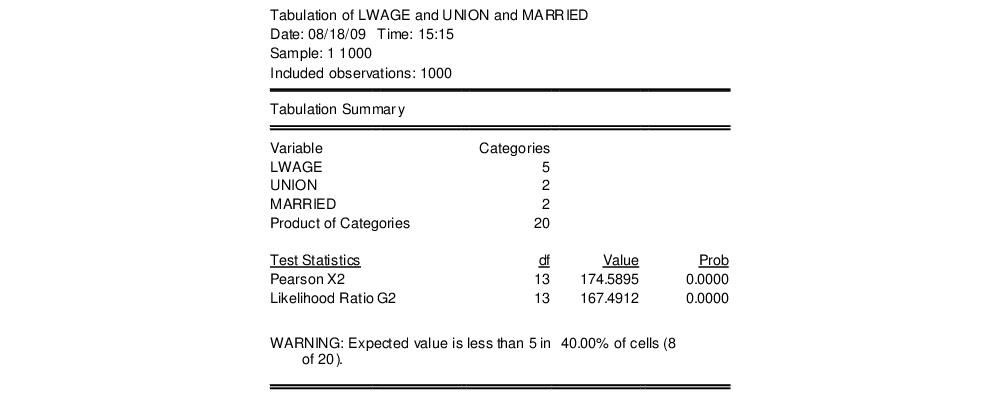
These test statistics are reported at the top of the contingency table. For example, the top portion of the tabulation output for the group containing LWAGE, UNION, and MARRIED in the workfile “Cps88.WF1” shows:
The three series LWAGE, UNION, and MARRIED, have

,

, and

categories, respectively. Note the WARNING message: if there are many cells with expected value less than 5, the small sample distribution of the test statistic under the null hypothesis may deviate considerably from the asymptotic

distribution.
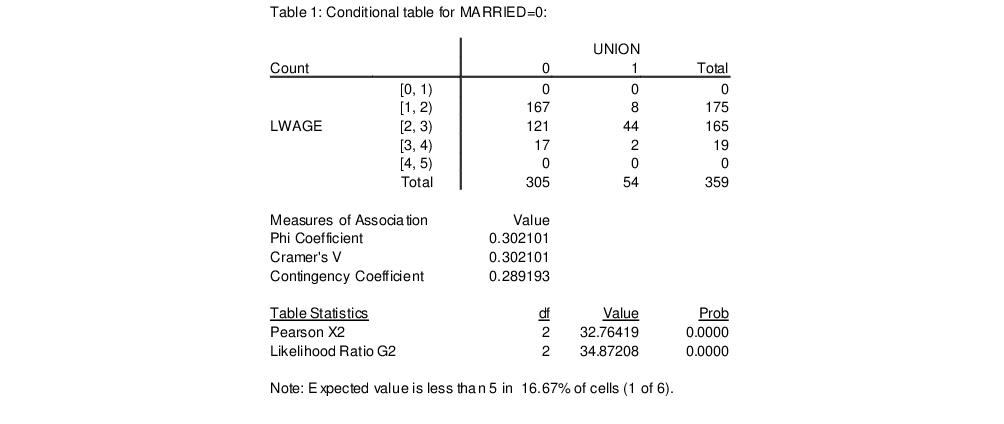
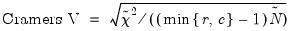
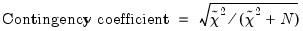
• . If you display in table mode, EViews presents measures of association for
each conditional table. These measures are analogous to the correlation coefficient; the larger the measure, the larger the association between the row series and the column series in the table. In addition to the Pearson

for the table, the following three measures of association are reported:
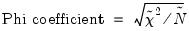 | (12.24) |
 | (12.25) |
 | (12.26) |
where min

is the smaller of the number of row categories

or column categories

of the table, and

is the number of observations in the table. Note that all three measures are bounded between 0 and 1, a higher number indicating a stronger relation between the two series in the table. While the correlation coefficient only measures the linear association between two series, these nonparametric measures are robust to departures from linearity.
Bear in mind that these measures of association are computed for each two-way table. The conditional tables are presented at the top, and the unconditional tables are reported at the bottom of the view.