
EViews Tutorials
Welcome to the EViews Tutorials center.
Below you will find a set of tutorials teaching the basics of EViews. The tutorials are split into self-contained sessions, although we recommend that new users of EViews work their way through the tutorials one by one.
Each tutorial is accompanied by data files so that you may follow the tutorials in your own copy of EViews. The data files are available in the Supporting Files side bar of each tutorial. Each tutorial is available in Microsoft Powerpoint® format, along with the data files, bundled together in a Zip file, in the Download Package area of of the side bar of each tutorial.
You should note that the tutorials are written based on EViews 11, however the vast majority of material covered in them is applicable to other versions of EViews too.
| 1. EViews Basics | A brief introduction to EViews, including a guide to finding your way around the EViews interface. | 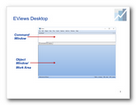 |
| 2. Workfiles | An introduction to the Workfile, EViews' main data file format, including how to create new empty workfiles, and how to import data from other sources into your EViews workfile. | 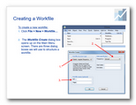 |
| 3. Samples | Samples are an important part of EViews, and allow you to easily work with different parts of your data. You will learn how to use EViews' deep understanding of time frequencies to easily select different date ranges to work with, or, if you are using cross-sectional data, pick different categories or cross-sections. | 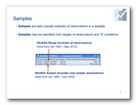 |
| 4. Series & Groups | The Series object is the most fundamental object in EViews - they are the objects that contain your data. This tutorial explains how to create new series, bring data into series, use automatically updating series, and how to display different views of your series. The Group object, which is simply a collection of Series objects, is also explained. | 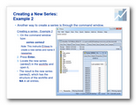 |
| 5. Data Functions | An introduction into the most common series creation and manipulation functions in EViews, including random-number generators, time-series functions and statistical functions. | 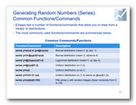 |
| 6. Date Functions | A description of the EViews functions that deal with dates and dated data. | 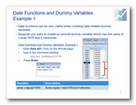 |
| 7. Dummy Variables | How to create binary, or dummy variables, based upon an observation's date, or the values of other variables. | 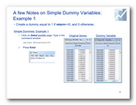 |
| 8. Frequency Conversion | Converting data from one frequency to another, including moving from high to low frequencies (e.g. from monthly to quarterly), low to high frequencies (e.g. quarterly to annual), and converting between different types of panel data. | 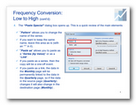 |
| 9. Basic Graphs | This tutorial covers how to create graphs of your data in EViews, including an explanation of Graph Objects compared to Graph Views, a summary of some of the most common graphing options, as well as an introduction to working with graphs of panel data. | 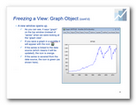 |
| 10. Statistical Analysis | An introduction to performing statistical analysis in EViews. Although not every statistical procedure is discribed, this tutorial should provide enough understanding to get you started. | 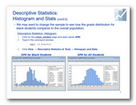 |
| 11. Tables and Spools | Tables are the basis of presentation output, whereas spools hold multiple collections of output objects (tables, graphs, equations). Spools are useful for organizing results and for working with multiple objects. Also covered are Dated Data Tables, which offer sophisticated tools to help you construct tables that combine original data along with transformations, frequency conversions, and summary statistics. | 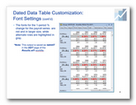 |
| 12. Basic Estimation | An introduction into estimation in EViews, focusing on linear regression. This tutorial includes information on specifying and creating new equation objects to perform estimation, as well as post-estimation analysis including working with residuals and hypothesis testing. Estimation options such as robust standard errors and weighted least-squares are also covered. | 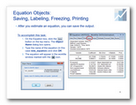 |
| 13. Time Series Estimation | Basic time series modelling in EViews, including using lags, taking differences, introducing seasonality and trends, as well as testing for serial correlation, estimating ARIMA models, and using heteroskedastic and autocorrelated consistent (HAC) standard errors. | 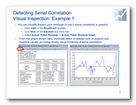 |
| 14. Forecasting | This tutorial explains the basic procedures for forecasting from a single equation. Both dynamic and static forecasting is covered, as well as forecasting from ARMA equations and equations with auto-series as the dependent variable. | 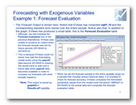 |
| 15. Programming | An introduction to EViews programming, including use of the command language, creating your own dialogs, and using Add-ins. |  |