EViews 13 New Features

"…improvements to our powerful graphing and presentation quality output…"
New Graph, Table and Geomap Features
Each version of EViews has always introduced improvements to our powerful graphing and presentation quality output engine, and EViews 13 is no different. Here are some of the improvements we've made to graphs in this version.
- Line and Shade Transparency
- Custom Data Labels
- High-low-median Colormap Presets
- Miscellaneous Improvements
Line and Shade Transparency
EViews 13 now allows you to customize the opacity (transparency) levels of individual lines and shades in a graph. By exercising fine control over the visibility of stacked graph elements, you can uncover previously hidden features of your data.
Custom Data Labels
Providing labels for data values can be an important tool for enhancing the information con- tent of graphical presentation of data. EViews 13 offers new automatic tools which make it easy to augment your graphs with informative custom data and observation-based labels.
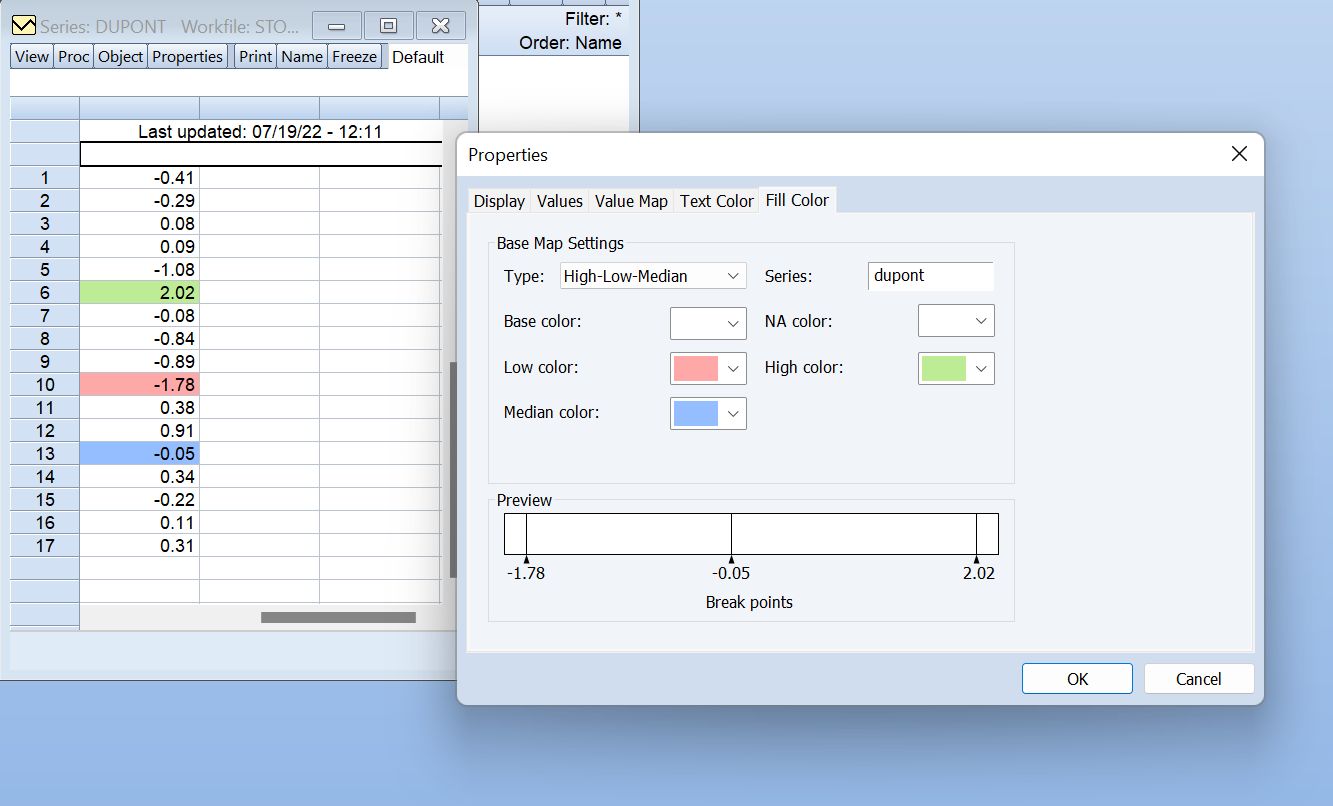
High-low-median Colormap Presets
EViews supports colormaps where you can define sets of rules that translate numeric values into colors. These colormaps may then be used when setting the text or fill color for series or group spreadsheets, or the fill colors in geomaps.
EViews 13 includes a new preset which allows users to identify the high, low, and median observations.
Miscellaneous Improvements
EViews 13 also includes miscellaneous other graphing improvements:
- Customizable Geomap labels.
- Fixed row and column display in tables.
- Improved table import/export.
- Search/Find within tables.
- Conditional table cell expressions